Stepping into the world of CNC machining can be incredibly exciting, yet equally overwhelming for beginners. With so many options available in the market—ranging from hobbyist desktop routers to heavy-duty industrial milling machines—making the right choice is crucial. Selecting the wrong machine can lead to wasted budget, steep learning curves, or limitations in your creative projects. This comprehensive guide will help you understand how to pick the right CNC machine tailored to your specific needs.
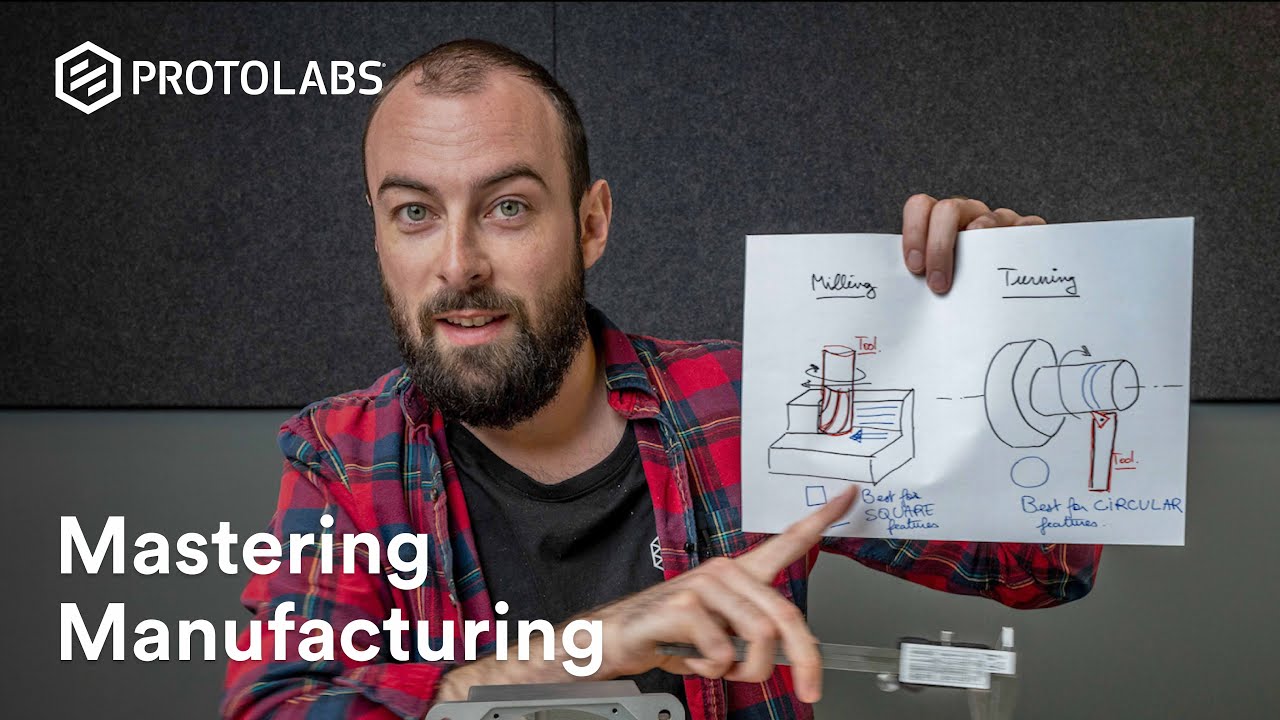
Understanding the Basics: CNC Router vs. CNC Mill
Before investing in hardware, you must understand the fundamental differences between the two primary types of machines available to makers and engineers:
- CNC Routers: Typically designed for softer materials like wood, plastics, acrylics, and soft metals like aluminum. They usually offer a larger work area and operate at higher spindle speeds, making them ideal for woodworking, sign making, and furniture production.
- CNC Mills: Engineered for cutting hard metals like steel, titanium, and brass. They are built with massive, rigid frames to handle high cutting forces and operate at lower speeds with high torque, focusing on extreme precision rather than large cutting areas.
Key Factors to Consider Before Buying
When evaluating your first CNC machine, keep these critical factors in mind to ensure your choice aligns with your production goals:
1. Material Compatibility
Always choose a machine based on what you plan to cut most frequently. If you are focusing on 3D woodwork or plastic prototyping, a router is perfect. If you need precise mechanical parts made of steel, a mill is non-negotiable.
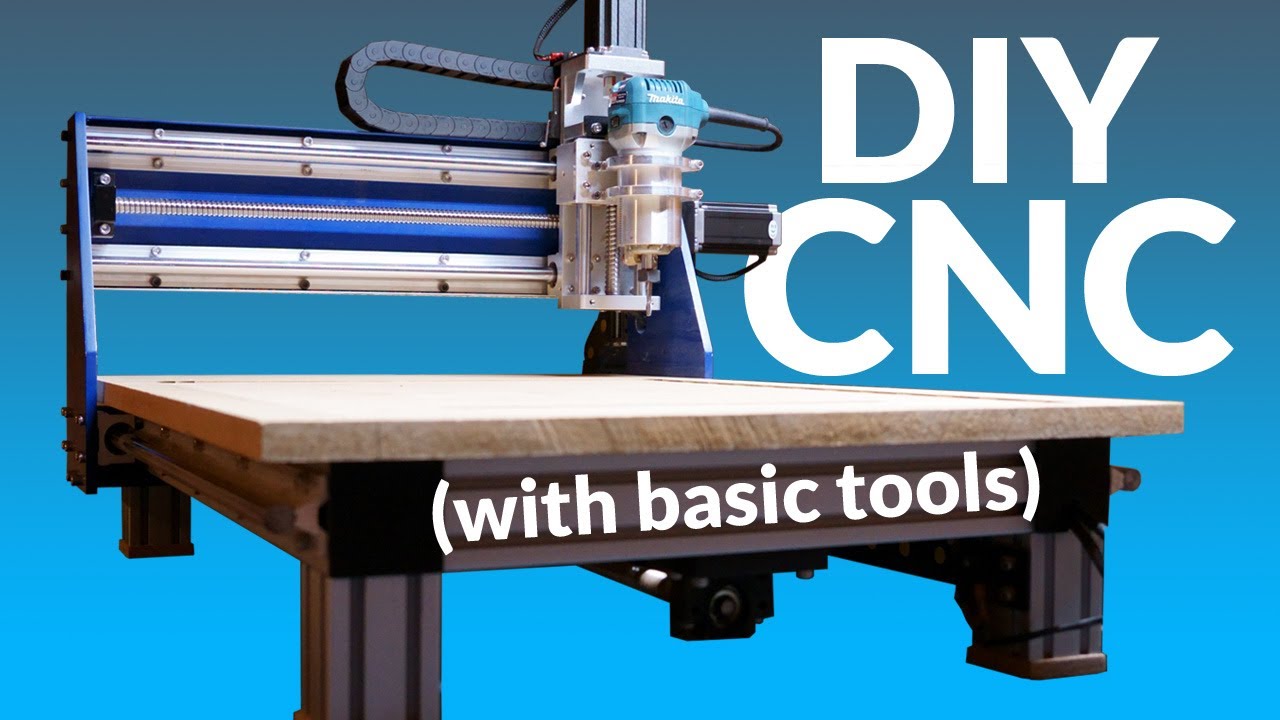
2. Working Area and Footprint
Measure your workshop space. Desktop CNC machines are great for small garages, but they limit the scale of your projects. Ensure the axis travel (X, Y, and Z dimensions) can accommodate your largest expected workpiece.
3. Software Integration (CAD/CAM)
A CNC machine is only as good as the software driving it. Platforms like Autodesk Fusion provide a seamless bridge between designing your part (CAD) and generating the toolpaths (CAM) required for the machine to execute the cut smoothly.
Watch the Step-by-Step Video Guide
For a visual breakdown on how to pick your machine and integrate it perfectly with modern CAM software, watch the full tutorial below:
Conclusion
Choosing your first CNC machine doesn't have to be a gamble. By analyzing your material needs, workspace constraints, and choosing a software ecosystem that grows with you, you can confidently invest in a tool that turns your digital concepts into physical reality. Start small, master the CAM toolpaths, and scale up your manufacturing capabilities as your skills evolve.